
The Pulse of My Micro Data Center
Every system has a heartbeat.
In my Micro Data Center, that heartbeat is digital — pulsing through routers, virtual machines, and power lines that keep everything alive.
Over the years, this small lab has grown into something bigger: a personal research environment where cloud concepts meet on-premise control.
Dozens of systems now run together — OpenVPN tunnels, MPTCP links, UPS units, and ESXi hosts — all working in quiet coordination.
Keeping that entire ecosystem in sync requires one thing above all: awareness.
Listening to the Heartbeat
At first, I relied entirely on Zabbix.
It gave me precision — deep analytics, metrics, triggers, and graphs that told me how every process behaved.
It’s the engineer’s microscope: accurate, reliable, and data-rich.


But as my setup expanded, I realized I needed another layer.
I considered adding Prometheus and Grafana — powerful tools for metrics visualization and time-series analysis — but they felt too heavy for what I wanted.
Not everything requires deep metrics or complex dashboards.
Sometimes I just want to know one thing:
“Is it up?”
And that’s exactly what I found in Uptime Kuma — a simpler, elegant layer focused on pure availability and real-time awareness.
The Simplicity of Knowing
Uptime Kuma doesn’t compete with Zabbix — it complements it.
It’s clean, focused, and designed for clarity.

It monitors my ecosystem through simple checks:
- 🌐 Connectivity: Internet, routers, VPN tunnels (ICMP)
- 🧩 DNS: Google (8.8.8.8) and internal resolvers
- ⚙️ Applications: Guacamole, Firefly, Bitwarden, GitLab, OpenProject
- 💾 APIs & Databases: Reachability via HTTP and TCP
With a quick glance, I can see if the system’s pulse is strong and steady — or if something’s out of rhythm.
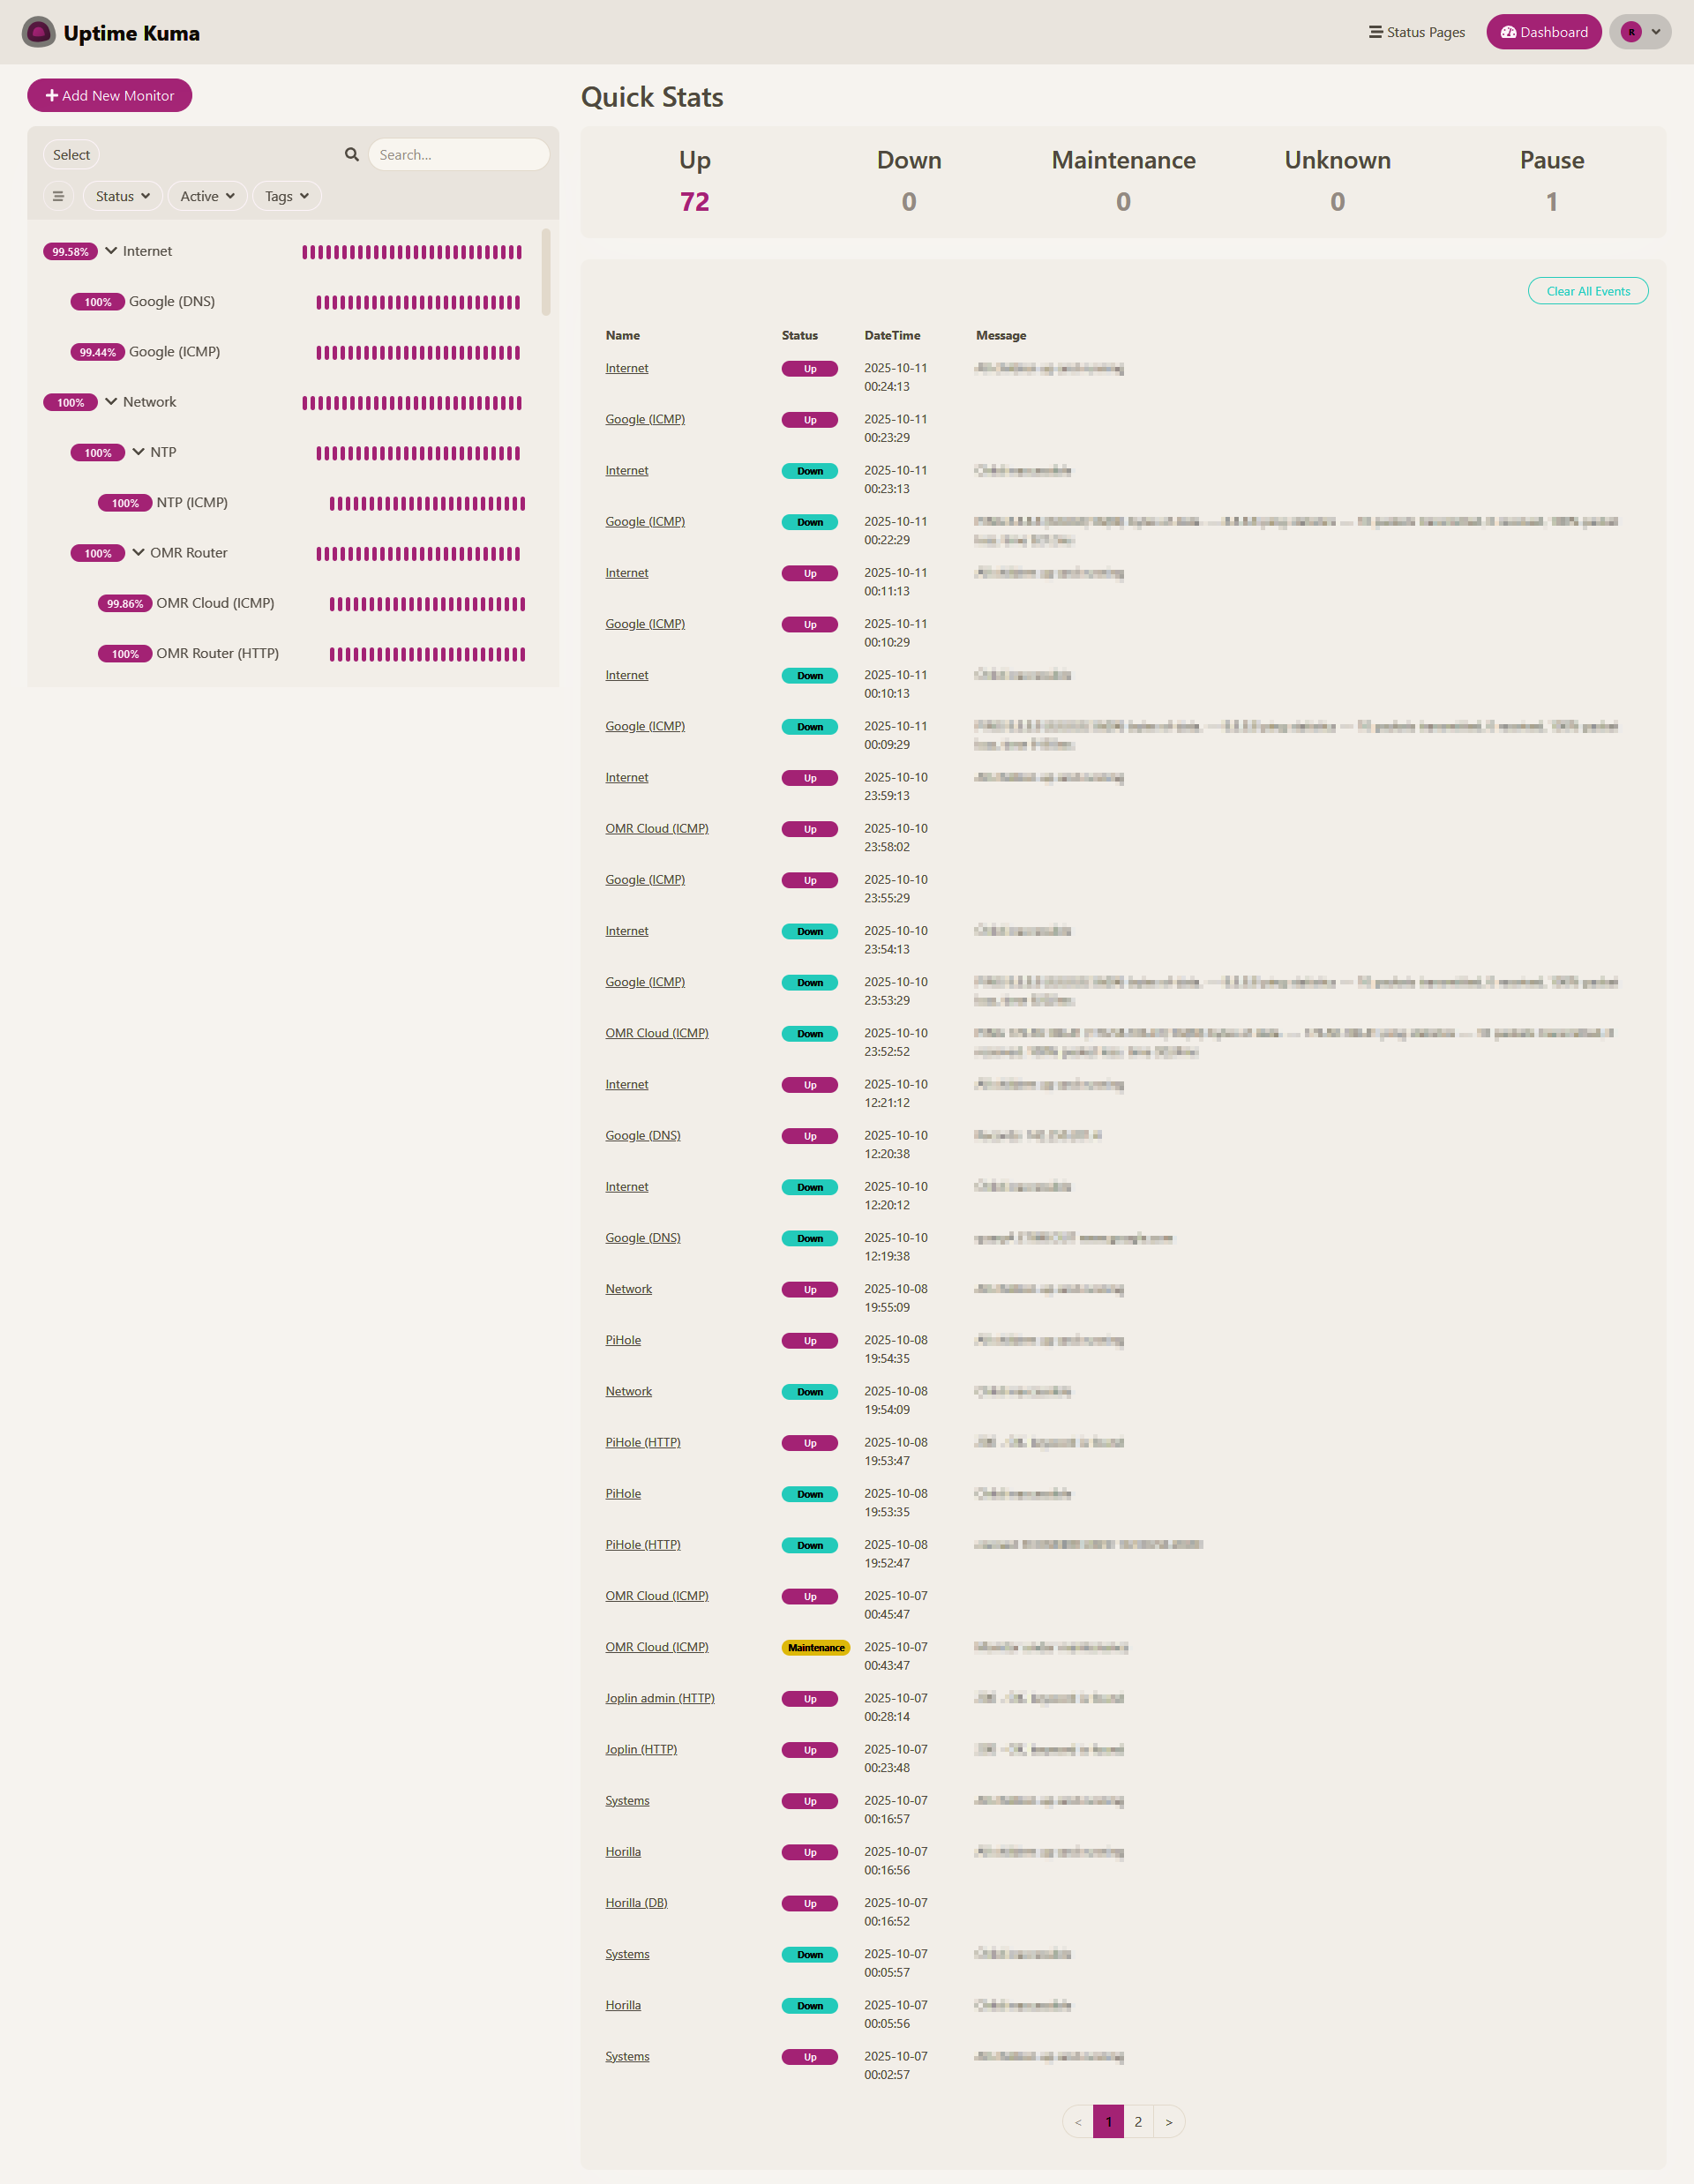
A Status Page for Peace of Mind
Uptime Kuma also gives me something I didn’t realize I was missing —
a status page that speaks in colors instead of numbers.

It’s my private version of status.atlassian.com:
simple uptime bars, grouped by systems and connectivity layers, all hosted within my own network.
Every green line means harmony.
Every red one means a beat was missed.

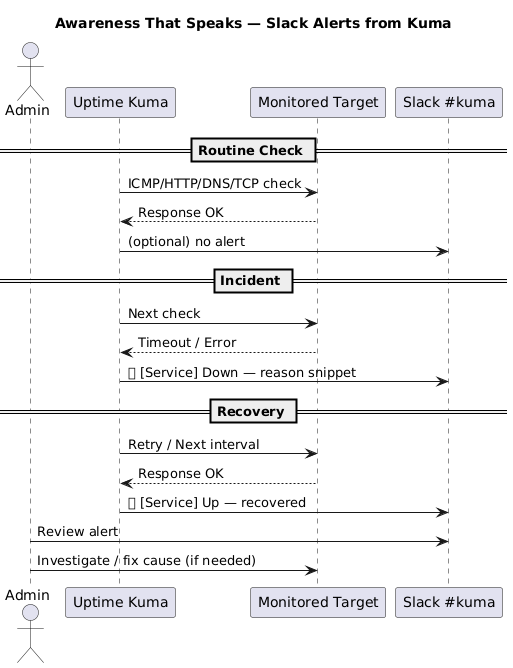
Awareness That Speaks
To make awareness instant, I integrated Kuma with Slack.
Now, every downtime or recovery message appears in my #kuma channel within seconds:
🔴 [Internet] Down — Child inaccessible
✅ [Google (ICMP)] Up — All children up and running
It’s quiet, reliable awareness — the kind that doesn’t shout for attention but simply informs.

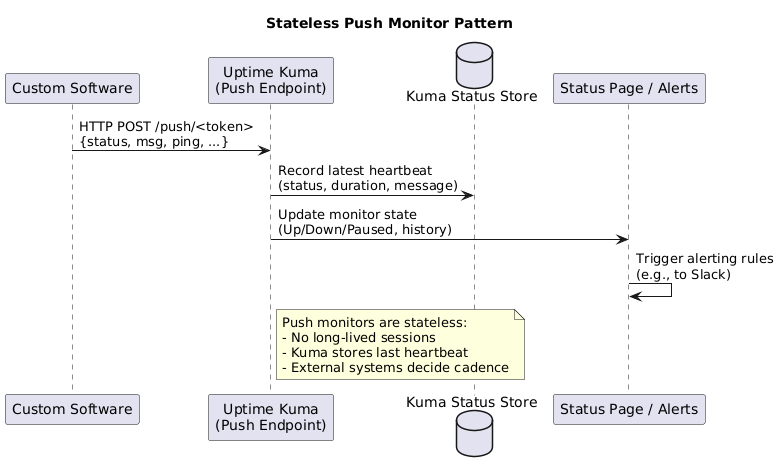
Integration with the Automation Layer
What makes Uptime Kuma even more powerful is its Push Monitor feature.
It’s stateless, which means external systems can send custom check-ins or data updates.
That’s ideal for integrations with my own tools.
I’m currently connecting it with PowerOps, my power orchestration system for the lab.
PowerOps manages UPS units, monitors power grid status, and coordinates ESXi host shutdowns and recoveries.
Uptime Kuma doesn’t have to stop at power signals. We can also feed network health—including MPTCP status and effective bandwidth tiers—straight into Push Monitors using a small script or micro-service. This keeps Kuma’s awareness “whole”: power + network.
Beyond Monitoring — Toward Intelligent Automation
What if Uptime Kuma didn’t just observe, but acted?
Imagine turning each monitor event into a trigger for your automation layer — whether it’s a simple n8n workflow, a custom PowerOps reaction, or even an early prototype of an IT AI Agent.
When Kuma detects a power failure, it could notify PowerOps to gracefully shut down hosts.
When network speed drops below a threshold, it could signal your optimizer script to reroute or restart MPTCP interfaces.
Each push becomes not just data — but intent.

Integrating Kuma with tools like n8n or custom agents transforms it from a dashboard into a digital nervous system:
sensors (monitors) detect anomalies, triggers fire, and autonomous scripts respond.
And yes — it’s risky to let AI take part in these loops.
But within carefully bounded use cases — like summarizing system alerts, classifying events, or recommending next steps — an AI-driven IT agent becomes not a threat, but an assistant.
Closing Thoughts
Monitoring isn’t about collecting more data — it’s about seeing clearly.
Zabbix tells me how my systems behave; Uptime Kuma shows me if they’re still awake.
Together, they form a complete awareness loop — from analytics to availability, from silence to signal.
But the horizon doesn’t end at awareness.
What if the watcher could think?
When Uptime Kuma becomes the pulse sensor, and automation platforms like PowerOps or n8n act as the muscles — an IT Agent could become the mind.
A digital caretaker that doesn’t replace the engineer, but assists — noticing patterns, summarizing alerts, suggesting actions, and learning from history.
It’s a cautious step toward sentient infrastructure — not a leap into autonomy, but a dance between insight and control.
A system that doesn’t just react, but understands why it reacts.


Pingback: GhostMachine: My Private Network in a Public World | RoofMan Official Blog